

Which side is your country on in a world of shifting powers?
Which side is your country on in a world of shifting powers?

Accidentally discovering leftover cold war structures in the multi billion dollar trade.
hello world,
With the current rise of populist movements in Europe or more recently the election of the next US president, it becomes clear that the tide within the western world is changing. While we globally have less conflicts than ever, there are nations that are manifesting their new influence and power in the world and are out to claim their position. In this process geopolitically weaker countries have to constantly reevaluate their allegiance. Thus, now it seems to be a good time to see where we stand today.
While I am by no means an expert on international relations , I believe that arms trade can offer an interesting and quantifiable perspective on global influence and international relationships.
the world is divided into east and west — on a spectrum
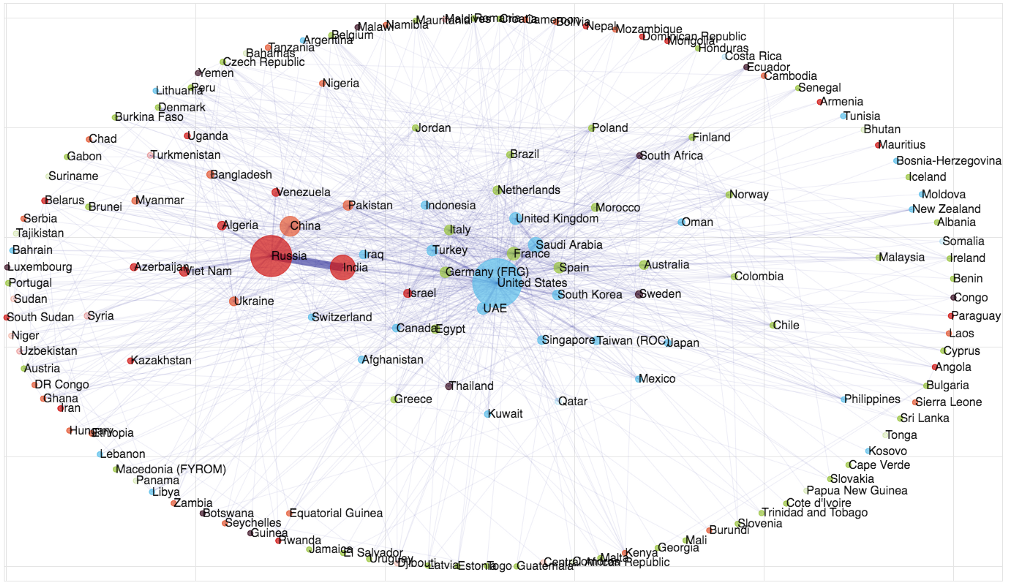
In order to explore relationships, I have accumulated and summarized data of the global arms trade into a graph, a structure that works well to analyze relationships between different actors. With the help of the Louvain method, I clustered each country into a community. The graph represents 754 connections, for 154 countries that are clustered into 5 communities. In total the transactions amount to about 135 billion USD between 2011 and 2015.
The rationale behind clustering countries together into communities is that weapon trade deals often have to be approved or are even concerted by governments. They therefore implicitly contain information about the relationship between countries. Only some government decide to sell weapons based on economic benefit (Hallå, Sweden!). Major weapon systems can last for decades and need vendor support throughout. Therefore, the purchase of such weapons is strongly governed by trust and vendor lock-in and is in any case a long term investment.
Example: Pakistan started importing mostly from Chinese manufacturers after the US embargoed the country due to the international tension caused by the Indo-Pakistani war of 1965. At the same time, India shifted towards imports from the Soviet Union (and now Russian) imports. Neither nations are very likely to switch back to their western suppliers.
There are five communities: Two pro-Eastern, two pro-Western and one outlier community (including Sweden).
We can clearly see the existence of a multitude of different communities of nations, but fundamental old patterns apparently do not fade so quickly in the world of arms trade.
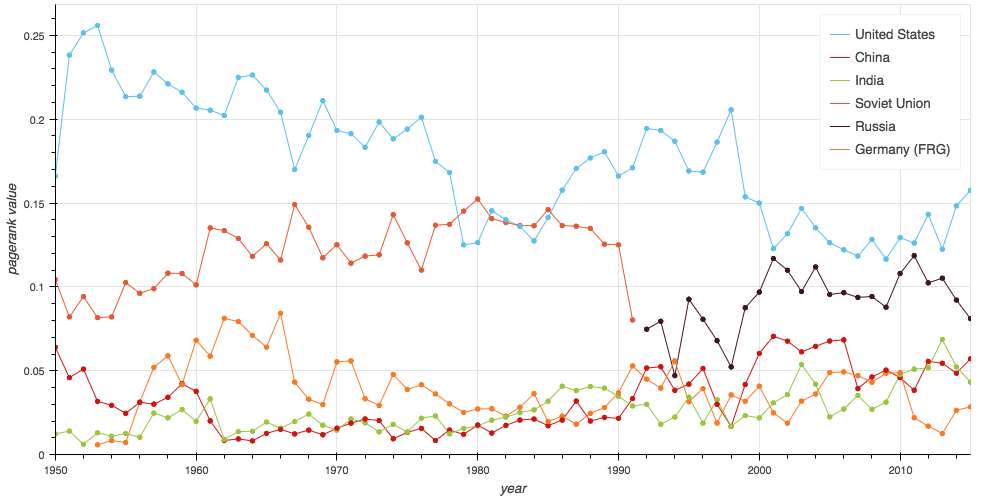
the leaders of these communities are highly influential entities: US, Russia and China (and the EU?)
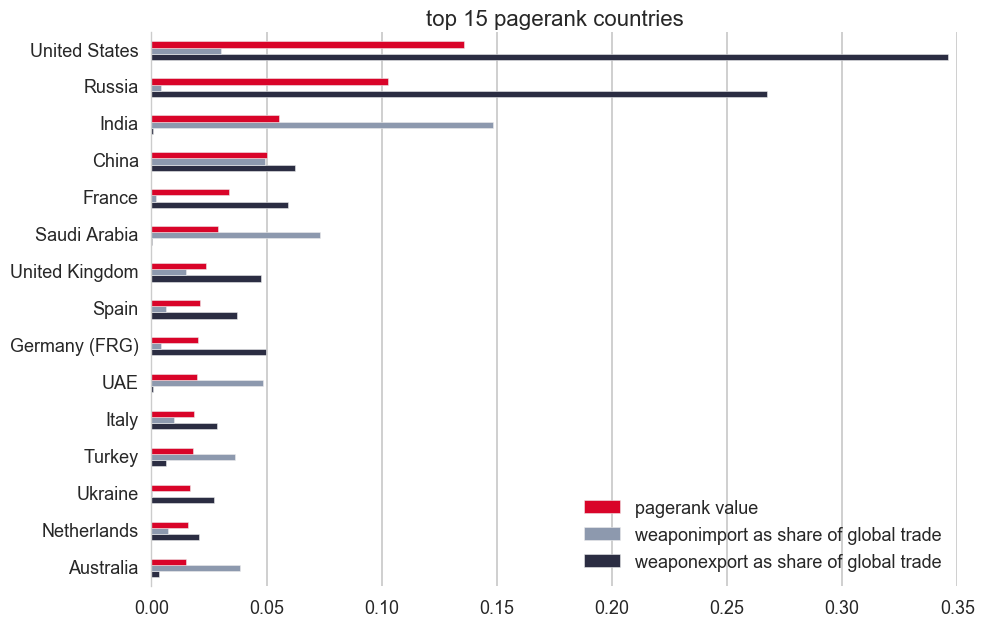
I am using pagerank to evaluate the “importance” of the top 15 entities. The two top countries are no surprise. The US and Russia are influential due to the large amounts of weapons that they export. The US for example operates a program called Foreign Military Financing to support its arms exports and drive its geopolitical interests. Other important exporters are China as well as a number of EU countries. Here is a graph charting the pagerank value of a selection of countries over time:
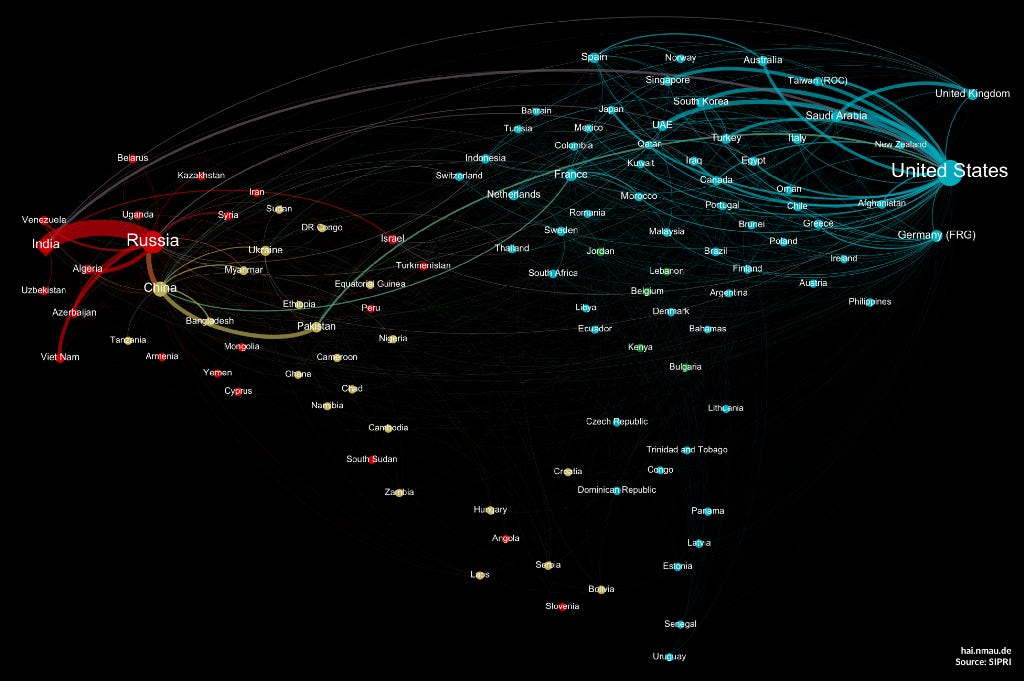
In order to examine the influence of the two top countries, I distilled the global network graph to show the export networks operated by Russia and the United States.
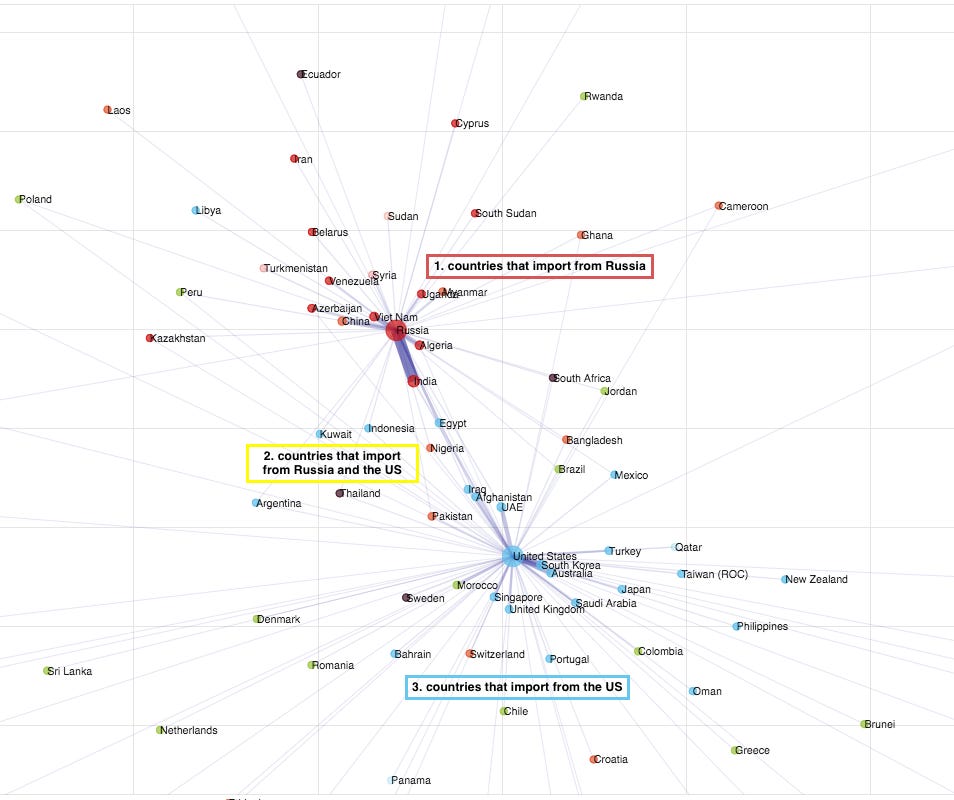
While most countries are either importing weapons from either the US or Russia, there is a class of countries that receive arms from both nations. These in-between countries are the exception to the rule, which is that most countries are still aligned with either the East (mostly Russia) or the West (mostly the US).
One interesting example is Hungary, an EU and NATO member, that seems to be moving closer within its relationship to Russia, not just in weapon trade. Generally, the US and EU seem to lose ground globally as of late with e.g. Manila shifting towards China away from the US. Or even within Europe, Bulgaria and Moldova are electing pro-Russian presidents (thanks, Lucy!).
the US and Russia accounted for 61.6% of the global weapon exports and the top importers are mostly Asian and Middle Eastern countries
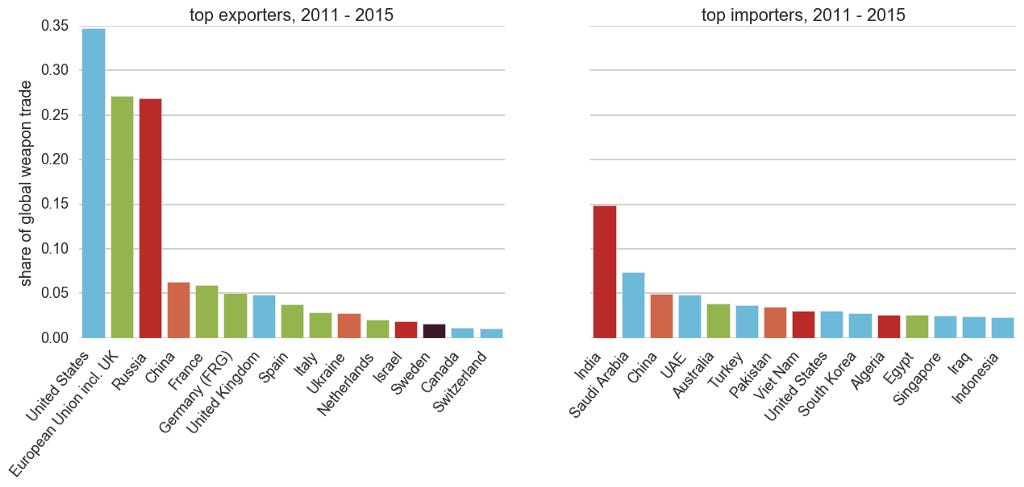
Looking at the bar chart it immediately becomes clear, that arms trade is a business with a long tail distribution, where few countries control the vast amount of weapon trade. That means from the perspective of weapon supply, there are basically three big buddies that any nation can have: the US, Russia or China. The EU could be a leader on the the same level, however it lacks the willingness and strategic leadership to do so. All of this could now change under the veil of the Brexit and the potential future isolationist stance of the US under the Trump presidency.
The US, Russia, China and the EU together account for almost 95% of exported weapons between 2011–2015.
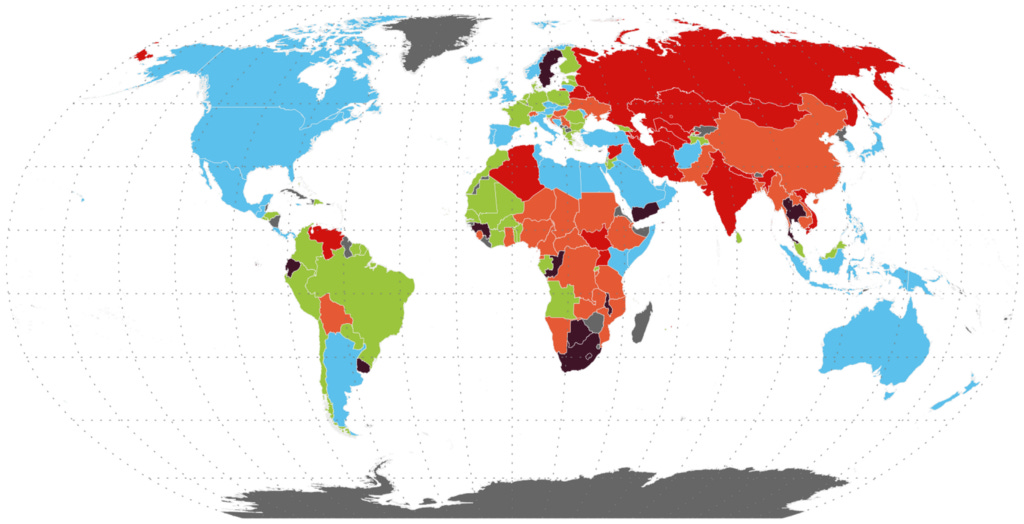
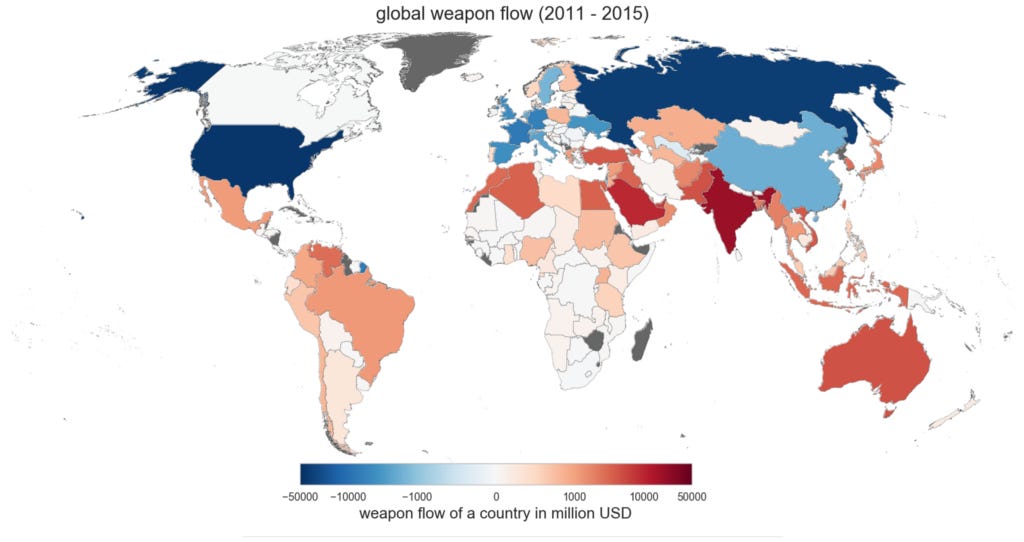
The following chart shows weapon exporters (blue) and importers (red). Besides pointing out potential future hotspots for conflicts, due to availability of major weapons, it also gives a clear indication where most of the global weapon manufacturing industry is based — surely not in the southern hemisphere.
the shift: US is still by far the leader in terms of military spending, but the others are cutting into this dominance fast
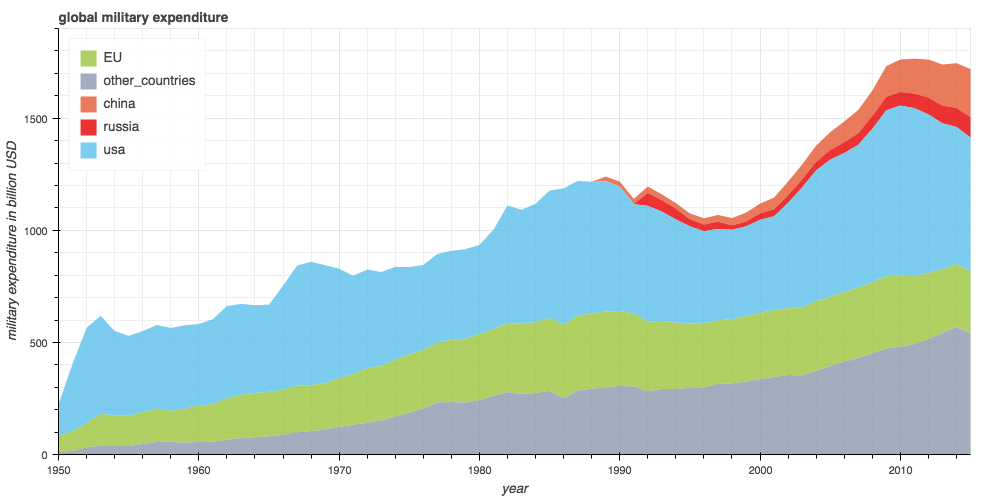
The global expenditure on military represents about 2.6% of the global GDP. The growth in military expenditure since the start of the “War on Terror” (aka an accumulation of wars, covert operations and cooperations) slowed in the Americas and Western Europe in the past years due to budget cuts. At the same time, however, armament strongly increased in other parts of the world, especially in Asia and Oceania.
Key challengers to the western world such as Russia and China are catching up to the military supremacy of the US with an unprecedented speed since the Cold War. And while power and influence cannot be solely defined through military expenditure, it is clear that China and Russia currently taking an active position in conflicts all over the globe. The lack of strategic leadership within the EU and the dysfunctional politics in Washington seem to call for an end of a world that used to be defined by Western dominance.
If you have read this text, you are most likely from a blue or green country. Let me know what you think or whether you disagree with any of the conclusions that I have drawn.
This article has been cited in Business Insider through Visual Capitalist, and has been translated into Portugese.
The unit of analysis is major conventional arms transfer, that includes systems such as airplanes, tanks, and missiles but not small arms and light weapons (aka. guns). Also: The transfer value is the production cost of these systems and not the actual financial value of the transaction (more information).
The underlying data comes mostly from the Stockholm International Peace Research Institute, which also provided me with their beta database for military expenditure. Thank you for that! More about the quality of the data can be found here. Credit also goes to Tobias Kalsbach, who contributed to kick off the munging of the data and gave valuable tips at the start. This was part of my path to pick up programming, all code was written in Python 2.7 and visualizations were created using pandas, matplotlib, seaborn and bokeh.
The underlying (and so far very unclean) code can be found here: https://github.com/mauhai/weaponstradeanalysis
Which side is your country on in a world of shifting powers? was originally published in Hai Nguyen Mau on Medium, where people are continuing the conversation by highlighting and responding to this story.